Data Engineering
Organize the data you have
End-to-end bespoke software delivery. Language-agnostic development. Building the future with cutting-edge AI and unparalleled technical expertise.

CodeBlaze enables teams to deploy high-impact AI quickly. We accelerate business growth through tailored AI consulting, engineering, and intelligent agent solutions.
We deliver innovative solutions that elevate your brand and scale with your business, driving impact, strengthening presence, and fueling growth

Click to view detail

Click to view detail

Click to view detail

Click to view detail

Click to view detail

We have completed 50+ projects, solving unique challenges every time.
Over 25+ AI-driven solutions crafted to meet diverse business challenges.
We're proud that 96% of our clients report being satisfied with our work.
Always on. Always ready. Our support team is available 24 hours a day, 7 days a week.
We combine strategy, technology, and change management to help organizations streamline operations.


What's covered with each skill?
Organize the data you have

Explore what information is hidden in your data
Predict what will happen using the data you already have
Detect, classify and learn new things from your data
Talk and create value with your data

Automation, Augmentation and Differentiation
Pick the plan that works for you - upgrade anytime as your needs grow.
We deliver custom software that aligns with your goals, boosts efficiency, and drives growth.
Smart enterprise mobile apps: reliable, packed with features, built to scale, and optimized for usability.
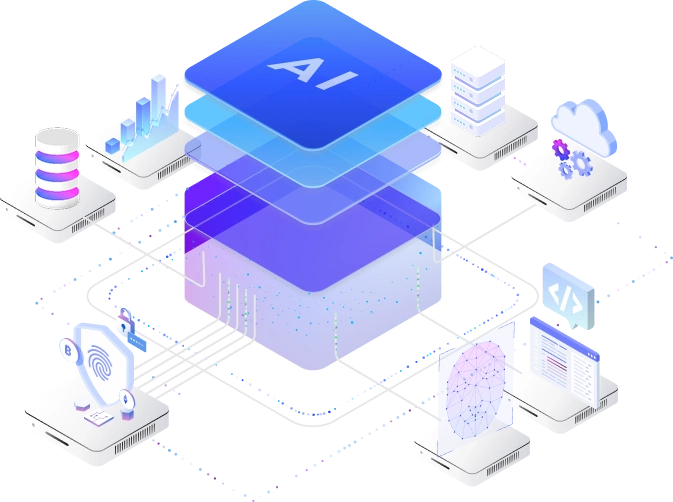
Harnessing AI & ML to transform data into action, powering innovation and efficiency.
Strategic, tech-powered solutions to keep your business agile and ready for the digital future.

Cloud migration boosts scalability, flexibility, and efficiency with secure access to data and applications.
Streamlined DevOps for faster delivery, higher reliability, and teams that adapt quickly.

We deliver custom software that aligns with your goals, boosts efficiency, and drives growth.
Smart enterprise mobile apps: reliable, packed with features, built to scale, and optimized for usability.
Harnessing AI & ML to transform data into action, powering innovation and efficiency.
Strategic, tech-powered solutions to keep your business agile and ready for the digital future.
Cloud migration boosts scalability, flexibility, and efficiency with secure access to data and applications.
Streamlined DevOps for faster delivery, higher reliability, and teams that adapt quickly.
Our Product Development Cycle defines the key stages we use to turn concepts into high-quality, customer-focused products.
We combine innovation and collaboration to deliver user-centered solutions that meet business goals.
We design solutions that align user needs with business goals through research and collaboration.

We build MVPs with core features to validate concepts, gather feedback, reduce risk, and speed up time to market.
We refine products through user insights and testing, ensuring performance, usability, and alignment with evolving needs

We launch with a strategic deployment that ensures seamless integration, strong performance, and readiness to scale.
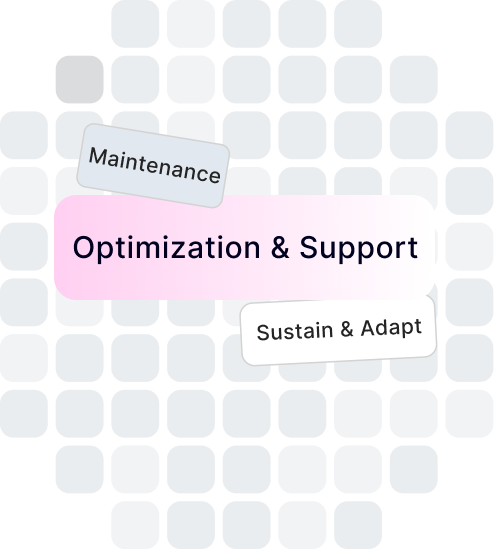
We offer ongoing support to sustain performance and adapt your product to evolving business and user needs.
We stand out through our strong engineering, industry expertise, and focus on delivering scalable, secure, and user-centric solutions that create measurable impact.
Disruption drains attention. Great tech should reduce mental friction, not add to it.
In the AI era, employees are reluctant to adopt what makes them feel lost, exposed, or replaceable.
Tech means nothing if people can't use it. We design intuitive experiences, provide hands-on support.
Even the smartest tools fail if they feel difficult or complex.
True transformation is felt. Not just in systems, but in culture, wellbeing, and confidence.
We deliver real, measurable value with minimal disruption to your tools, workflows, or culture.
Passionate. Proactive. Expert.


We don’t just deliver projects—we build long-term collaborations grounded in trust, clarity, and shared ambition. These reviews reflect the way we work: transparent, strategic, and fully invested in our client’s success.

Having worked with multiple development teams in the past—including one in the UK, one in South America, and another in Eastern Europe—I can say with complete confidence that our current tech team at Codeblaze is on a different level
From design to implementation, these guys and girls were streets ahead in every aspect of the application. Their creativity, attention to detail, and ability to turn complex requirements into a seamless user experience has completely transformed the way we build.
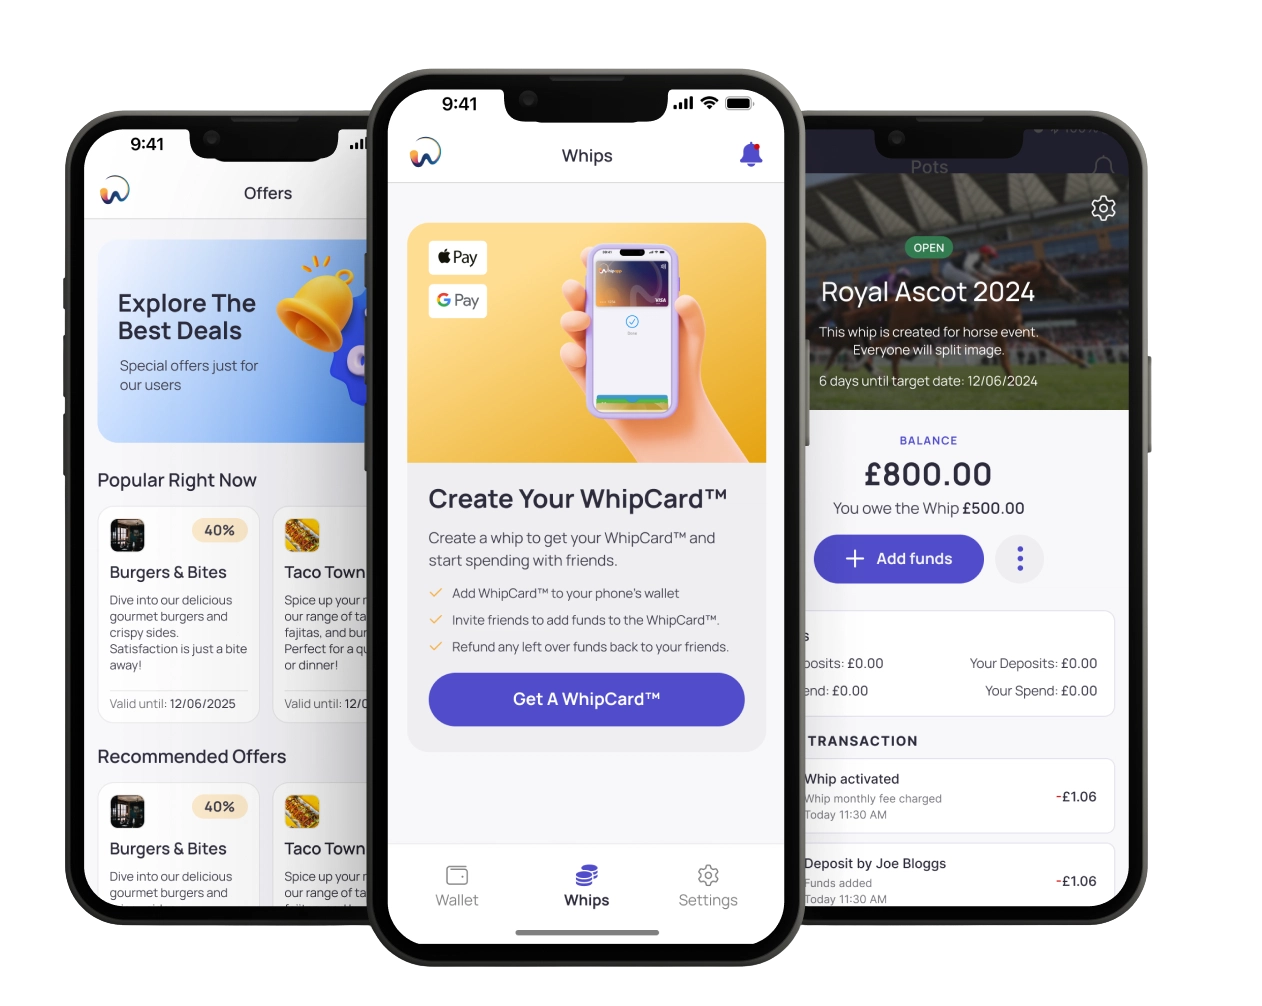
What sets Codeblaze apart isn't just technical excellence, but the way they operate as true partners. They communicate clearly, move with urgency, and consistently go above and beyond to ensure My Whip App keeps pushing boundaries.
After experiencing inconsistency and challenges with previous teams, the stability, innovation, and execution delivered by Codeblaze has been nothing short of outstanding. They've helped us refine our vision, solve difficult problems, and build a product we're genuinely proud of.
We're incredibly grateful for their contribution, and we look forward to working with the Codeblaze team for many years to come.

I've worked with Codeblaze across several years, multiple countries, and a wide variety of digital projects and the experience has been exceptional every single time. They don't just build what you ask for; they elevate it. Every challenge I've brought to them has been met with creativity, clarity, and outstanding technical execution.
What I appreciate most is how they work: collaborative, transparent, and fully committed to delivering something better than you imagined. They've become far more than a development partner, they are part of the team, and I trust them implicitly to bring big ideas to life. Codeblaze sets a high standard, and I look forward to continuing our collaboration.

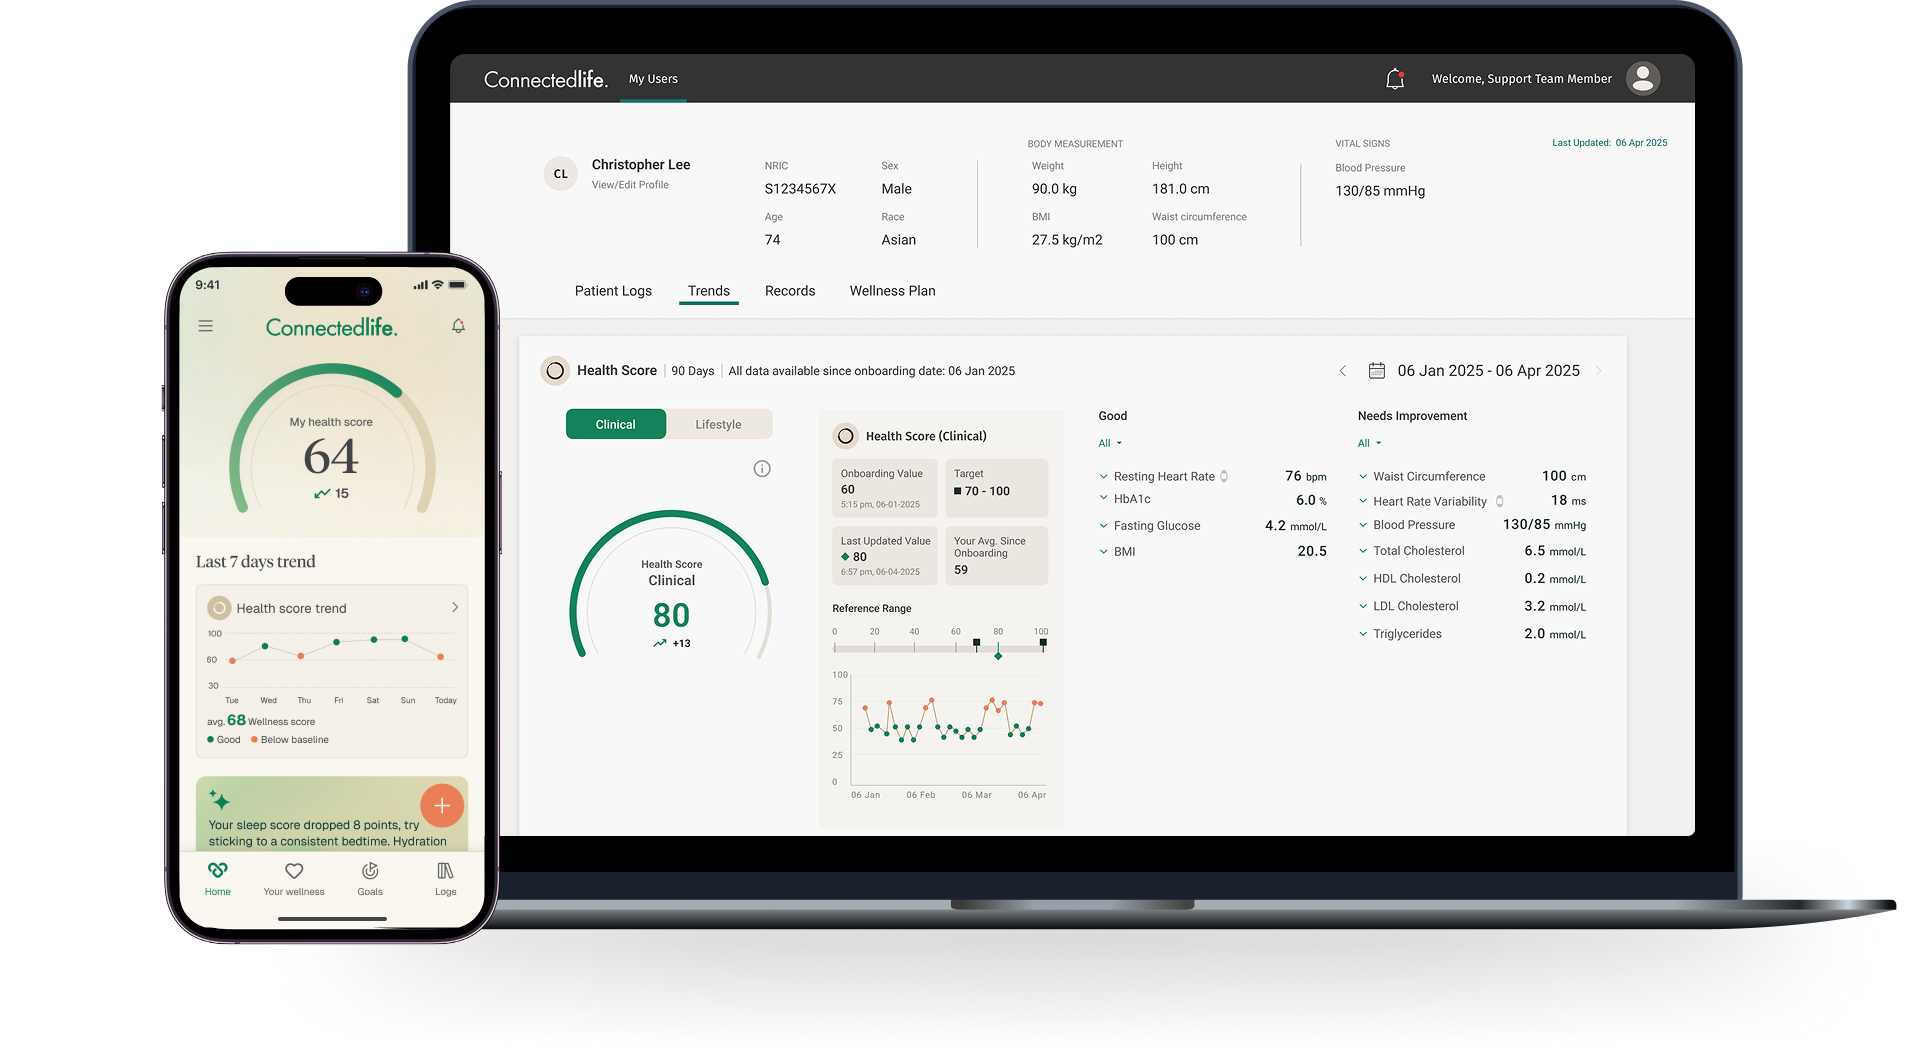
CodeBlaze has been an invaluable technology partner for ConnectedLife Health over the past several years. Their team consistently delivers high-quality software solutions that meet our demanding requirements in the digital health space.
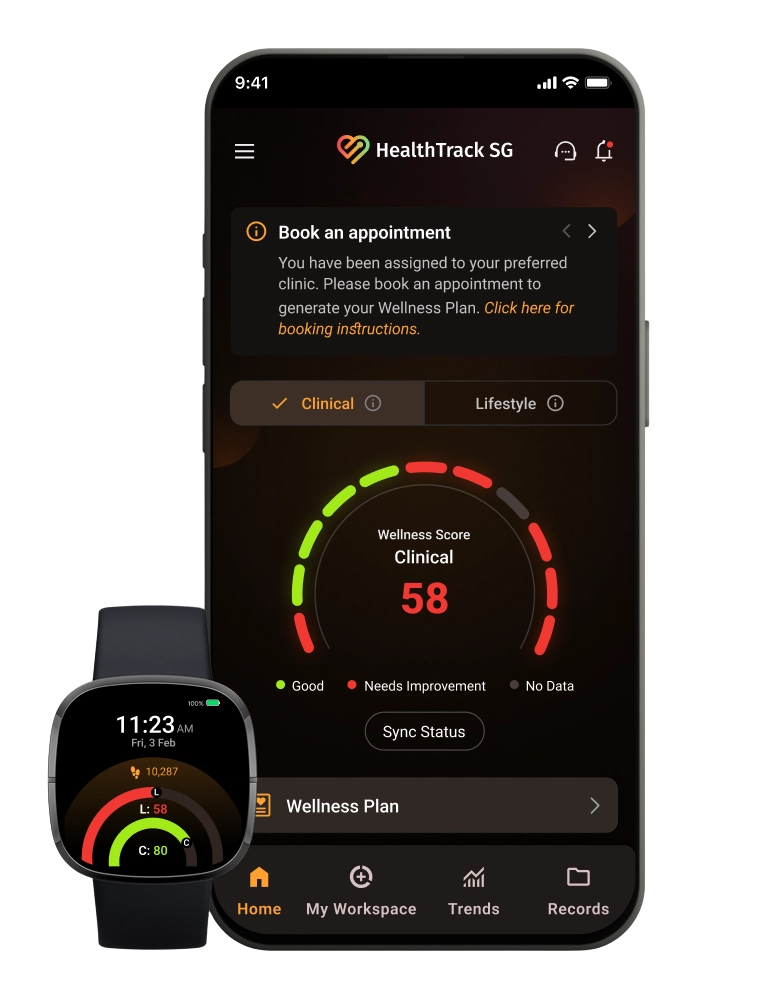
What sets CodeBlaze apart is their ability to understand complex healthcare workflows and translate them into intuitive, robust applications. From our core telehealth platform to intricate integrations with wearable devices and third-party systems, they've demonstrated both technical excellence and a genuine commitment to our mission of improving patient outcomes.
Their agile approach, clear communication, and willingness to go the extra mile have made them a trusted extension of our own team. I'd recommend CodeBlaze to any organisation looking for a reliable, skilled software development partner.

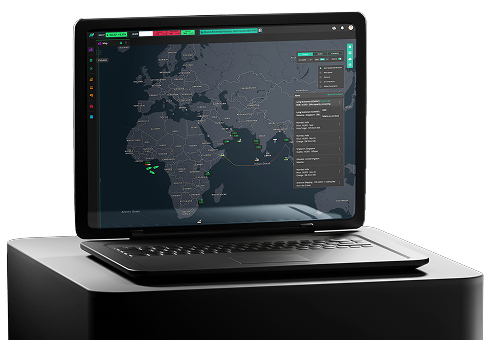
As the engineering arm of Simba Investments, CodeBlaze plays a critical role in driving technology across our entire portfolio. They're not just a service provider—they're embedded in how we build and scale businesses.
Whether it's developing new platforms from the ground up, modernising legacy systems, or providing ongoing technical support for our portfolio companies, CodeBlaze delivers with consistency and professionalism. Their ability to work across diverse sectors—from health tech to real estate to financial services—gives us the flexibility to move quickly on new ventures without compromising on quality.
Having a dedicated technology partner that truly understands our strategic priorities has been a significant competitive advantage. CodeBlaze enables us to focus on growth while they handle the engineering complexity behind the scenes.

Unique Sports Group partnered with CodeBlaze to build Unique Intelligence, a Progressive Web App that empowers our agents to track players, monitor contracts, and analyse performance data across global football markets. The team delivered Phase 1 on time with exceptional creativity, strong technical execution, and transparent communication throughout. They didn't just build what we asked for—they refined our ideas and enhanced the user experience beyond our expectations. The result is a platform we're proud of and one that sets a strong foundation for future innovation. In Phase 2, we're expanding the partnership to integrate AI-powered natural language queries, advanced player rating systems, and agency intelligence tools—giving our team instant access to comprehensive insights from anywhere in the world.
CodeBlaze has proven to be more than a development partner, and we look forward to continuing this collaboration as the platform evolves.